Smart Retail People Flow Heatmap — Deployment Guide

Preset

AI Camera Direct

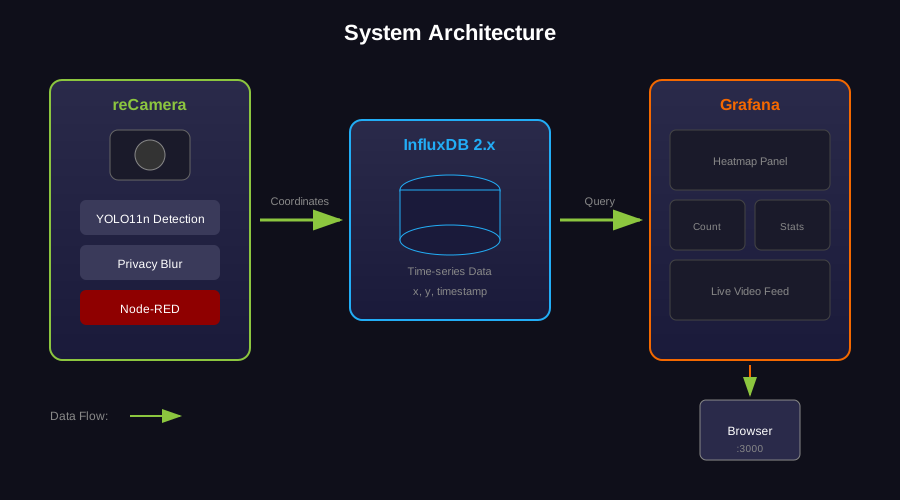
reCamera detects people on the camera and publishes results over MQTT; a computer or reComputer R1100 runs the dashboard and keeps the history.

  • Devices: reCamera; a computer or reComputer R1100 for the dashboard.
  • Software: Docker on the dashboard machine, at least 2 GB free disk.
  • Network: all devices on the same network.
1

Start Data Dashboard

Start the MQTT broker, database, Grafana dashboard and video gateway. Every camera publishes here. Deployment discovers ONVIF cameras on the same subnet; if the backend and cameras are on different subnets, enter the camera addresses in the deploy form.

Deployment method
Wiring

Wiring

Make sure Docker Desktop is running.

What you will be asked for(filled in the SenseCraft Solution app)
  • Camera RTSP URLs (optional)

    Only needed for cameras ONVIF discovery cannot see — one per entry as id=url, comma separated

Troubleshooting
SymptomFix
Port conflict errorFree ports 8086, 3000, 8080 and 1883
Docker not availableStart Docker Desktop
Not enough diskKeep at least 2 GB free
2

Connect Camera to Dashboard

Install the retail analytics app on the reCamera and set the broker it publishes to. The app reports dwell state (browsing / engaged / needs assistance) and entry/exit counts.

Wiring
  1. Over USB the IP is 192.168.42.1; over Ethernet or WiFi, find the IP in your router admin page
  2. Enter the reCamera IP, the MQTT server IP (the machine from Step 1), an installation name and a camera ID
  3. Cameras in one store share an installation name and use different camera IDs; the dashboard uses these to tell devices apart

This step disables Node-RED autostart; the two cannot run at the same time.

Troubleshooting
SymptomFix
Cannot connectUSB: use 192.168.42.1; network: check router for IP
No data showingMake sure Step 1 completed and camera and server are on the same network
Fails to start with a device_init assertionReboot the camera

3

Map Heatmap to Floor Plan (Optional)

The heatmap shows the camera's perspective by default. Use the built-in calibration tool to show it on your store's floor plan.

How to Do It

  1. Open http://<server-ip>:8080 in your browser
  2. Click the gear icon (top-right corner) to open calibration settings
  3. Pick the camera to calibrate ("All cameras" sets the default for any camera without its own calibration)
  4. Upload a camera screenshot (left side) and your floor plan image (right side)
  5. Click 4 reference points on the camera view, then the same 4 spots on the floor plan; use widely spaced landmarks such as pillars, doorways or corners
  6. Click Save; calibration applies immediately

Calibrated cameras share one floor plan. The dropdown at the top-left narrows the view to a single camera.

Skip This If

You only need the camera-view heatmap.
Troubleshooting
SymptomFix
Heatmap doesn't align wellOpen settings, click Reset, and recalibrate with different reference points
Calibration survives a browser changeExpected; calibration is stored on the server
4

Open Dashboard

Click below to open the Grafana dashboard.

Troubleshooting
SymptomFix
Page not loadingMake sure Step 1 deployed successfully; run docker ps on the server to check services
Wrong host/portIf you deployed to a remote device, use its IP in the URL
No dataMake sure Step 2 completed and the MQTT server IP is the machine from Step 1
After Deployment
  • Data Dashboard: http://<server-ip>:3000, login admin / admin, traffic trends
  • Live Heatmap: http://<server-ip>:8080 (calibrate via the gear icon)
  • Video gateway: http://<server-ip>:1984, discovered cameras and preview